Analog
Analog produces a simple summary of all the people who have visited your site.
It is fast and provides great lightweight statistics.
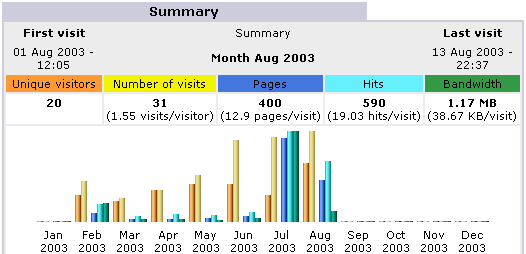
Awstats
Awstats produces very pretty stats.
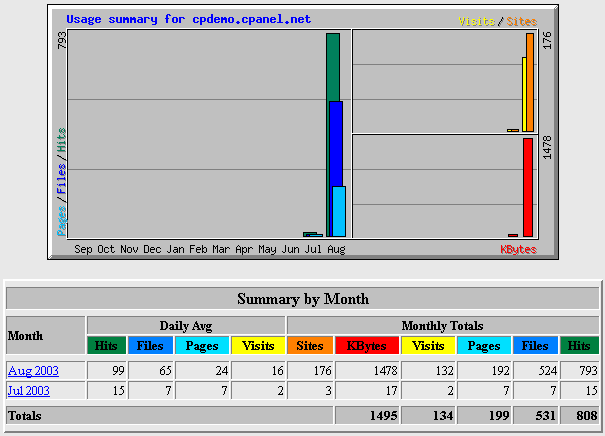
Webalizer
Webalizer is a more complex stats program that produces a nice variety of charts
and graphs about who has visited your site. This is probably the most popular
stats engine available today.
Subdomain Stats
This will show statistics for the subdomains on your account.
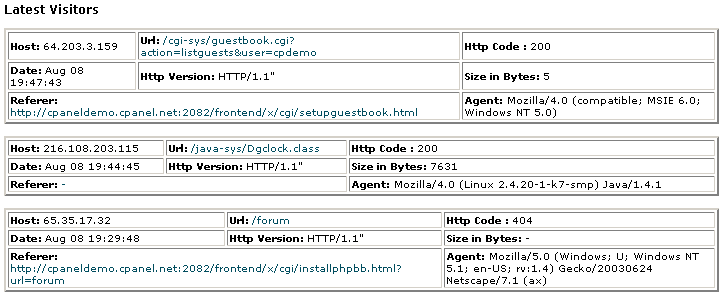
Latest Visitors
This will show you the last 300 visitors who came to your site and some
interesting information about them.
Bandwidth
This will show how many bytes your account has transferred.
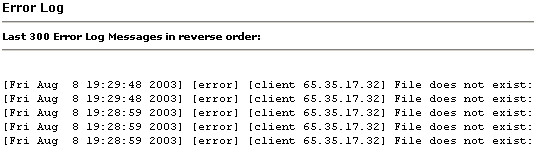
Error
Log
This will show errors in your site, images not loading, missing files, etc. This
is very useful for debugging CGI scripts.
![]() The Web / FTP Statistics area presents you with a wide variety of information
about your web site, from the latest visitors to a detailed monthly summary of
hits, as well as providing an error log. Use the Statistics tools to keep track
of what pages are being visited most often, and where they are being referred
from.
The Web / FTP Statistics area presents you with a wide variety of information
about your web site, from the latest visitors to a detailed monthly summary of
hits, as well as providing an error log. Use the Statistics tools to keep track
of what pages are being visited most often, and where they are being referred
from.
For more information about exactly what these web site statistics mean, refer to the following excellent articles:
The Analog reporting tool presents a comprehensive coverage of web server statistics available for your web site using CPanel. Refer to the following links for more information about the Analog tool:
To use the Analog tool:
The Awstats reporting tool combines a comprehensive coverage of web server statistics available for your web site with very attractive reporting pages. Refer to the Awstats home page for more information about Awstats.
To use Awstats:
The Webalizer tool creates a graphical summary display of usage of your site. This is useful to give you a quick and clear overview of your web site activity. Refer to the Webalizer home page for more information about Awstats.
To use Webalizer:
This quick tool lists the last 300 visitors that have visited your site in the last 24 hours. Note that visitors are defined as requests from servers, not individual people.
To view the most recent visitors:
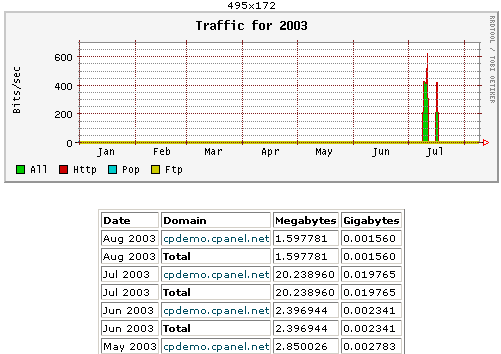
The Bandwidth tool generates an overall summary of the amount of bandwidth that your site is using. This is generated from HTTP traffic (looking at your web site, downloading files, etc.) and possibly FTP traffic. However, this does not include any other type of traffic, the most notable of which is POP3 - e-mail. Depending on what files you send and receive through e-mail, this amount could be considerable. Contact your hosting administrator if you want to check how much bandwidth you are using.
To check how much bandwidth is being used:
The error log contains all HTTP errors that occur when visitors attempt to view your site, such as requested files not found, etc. The Error Log tool is a presentation of the last 300 entries in your error log. A central use of this tool is to locate suspicious server activity, such as attempted virus attacks. Please contact your hosting administrator if you have concerns about activity in your error logs.
To check your error log: